
Taking advantage of free EDF Browser and free Audacity(R) programs, our EEG and ECG data set can be brought to live, and actually quite easy to read out our internal activities.
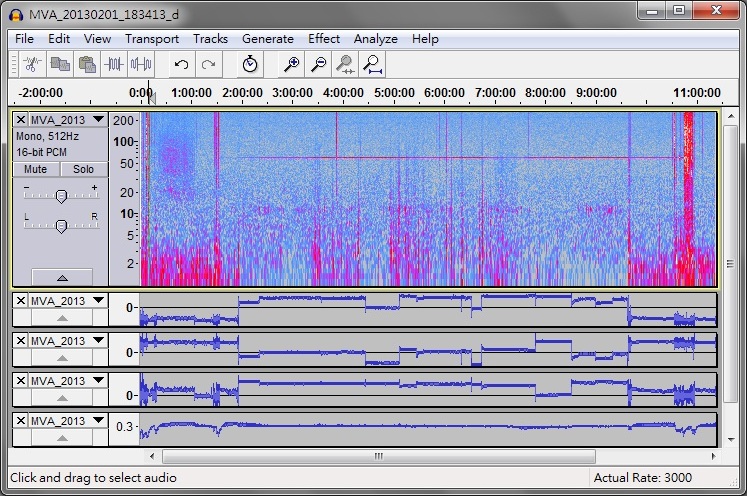
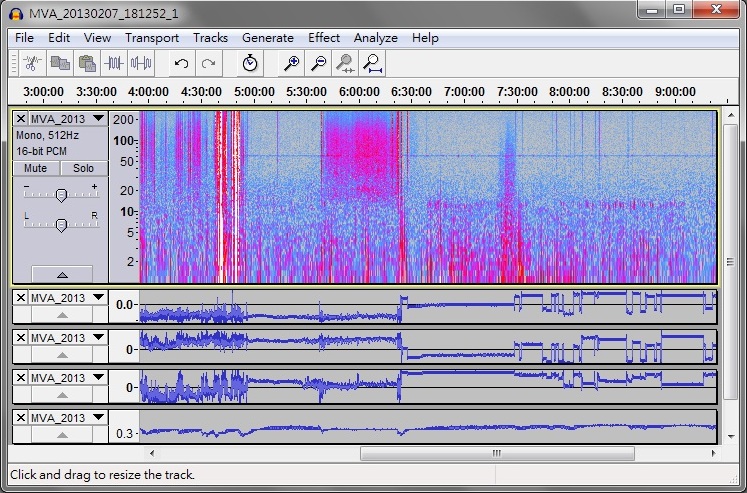
1. EEG: Audacity(R) showing EEG spectrogram and corresponding 3D accelerometer and temperature sensor data. For a whole evening: walking, dinner, video watching, book reading, meditation, sleep, meditation, breakfast and music listening. The accelerometer data show clearly how the head posture changed with each activity. The various sleep stages and patterns are also easily discernible.
2. EEG: Zoom in to the section for dinner, video watching (note how the beta and gamma bands light up) and book reading. The muscle (EMG) activities have clear signature (strongest at highest frequency, and spill down to ~30Hz) distinct from the brain (beta, gamma waves) activities (strongest between 30~100Hz).
3. EEG: Continue to meditation (not shown here are the little dozing picked up by accelerometer-Z sensor) and then sleep.
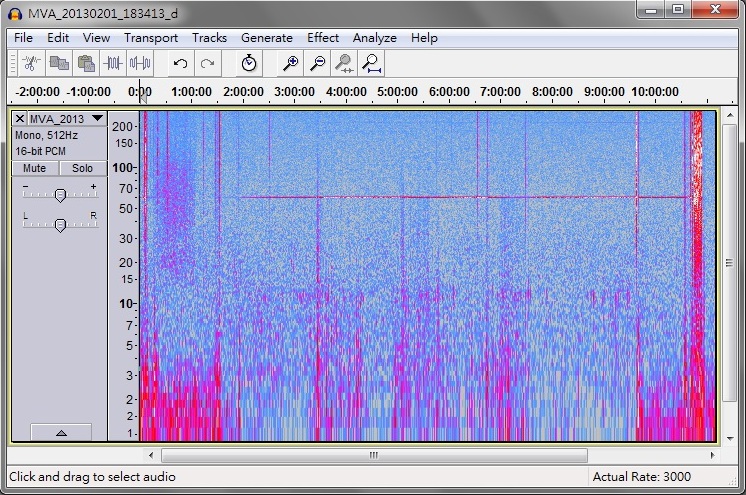
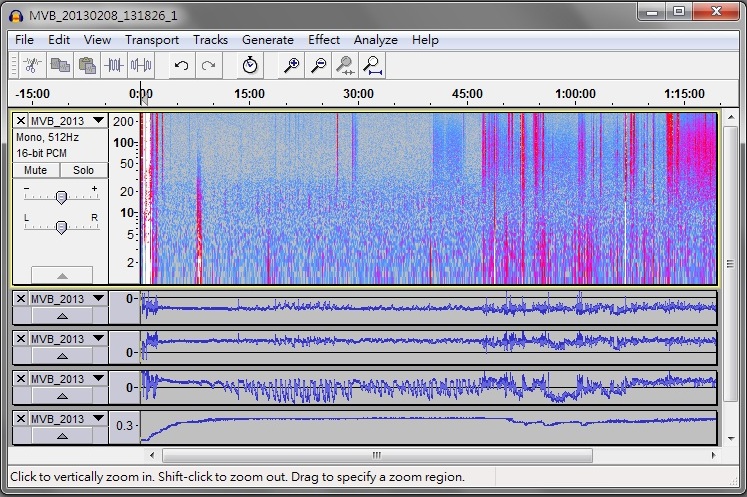
4. EEG: Zoom out to the whole night, showing meditation-sleep-meditation sequence, they are clearly distinct.
5. EEG+ECG: now add the ECG data, in the form of extracted heart-rate variations (HRV), see how the HRV patterns change with different activities.
.jpg)
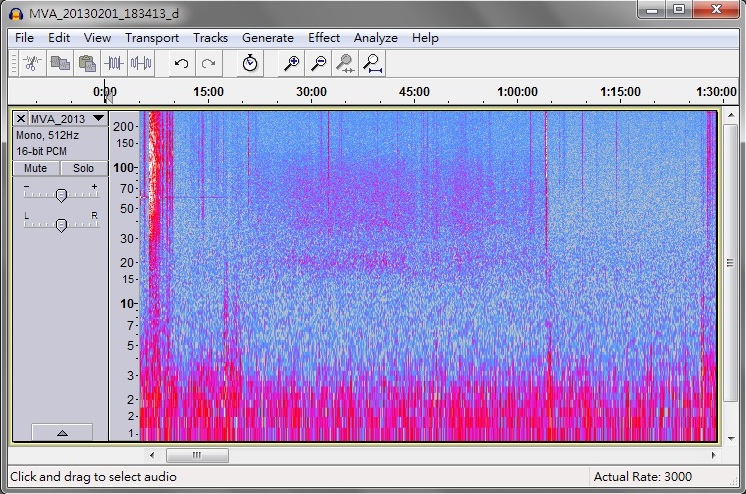
6. ECG(HRV): to view spectrogram of HRV, we need to do a liitle trick, by changing the sampling rate from 32Hz to 32000Hz (x1000), now the 1 ~400Hz scale corresponds to 0.001~0.4Hz for HRV. We can study our heart rhythms and our antonomous nervous system (ANS) in action.
 Spectrogram Night x1000.jpg)
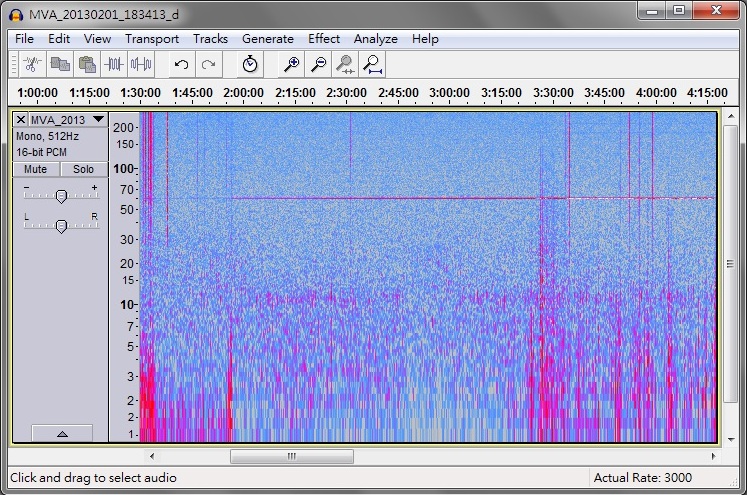
7. ECG(HRV): now zoom in to see the distinct features before and after onset of deep sleep stages.
 Spectrogram deep sleep x1000.jpg)
8. EEG: same as 1, but using sensor data from another person. Note the differences and similarities between persons.
9. EEG: meditation at nap time (early afternoon) followed by active work. See how our body naturally achieves rejuvenation by dozing off, as captured by accelerometer-Z sensor data.
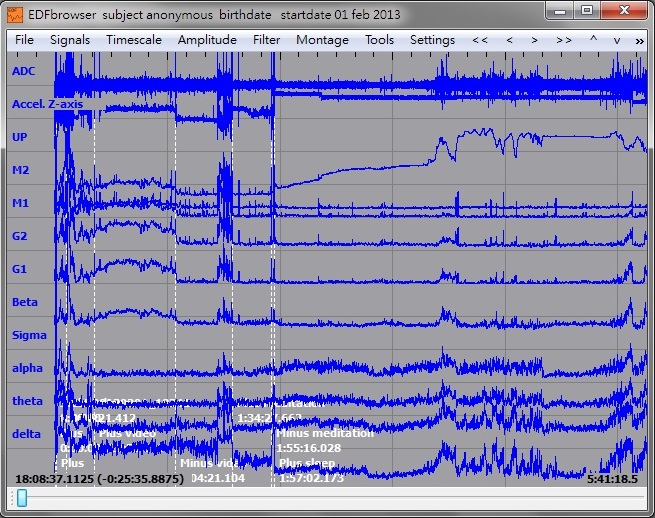
10. EEG: the same whole night data viewed using EDF Browser, showing all the traditional EEG frequency bands (delta, theta, alpha, sigma=sleep spindles, beta, gamma (or super beta), and muscle (M for EMG) bands. Also shown is the "utility pollution (UP)", i.e. the 50Hz/60Hz power line frequency (and their harmonics) as captured by our body when nearing various electric appliances and electronics devices. It's hard to escape UP totally, but there are huge differences in intensity among different locations.
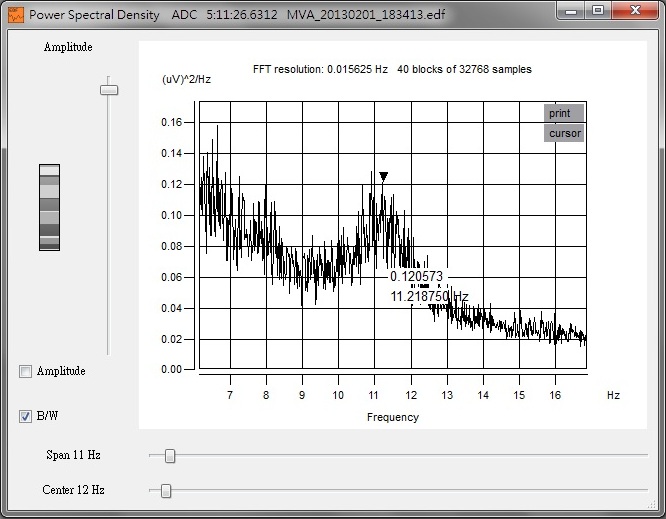
11. EEG: using EDF Browser, we can select the sleep/deep sleep section, and get accurate read out of our specific sigma (sleep spindle) wave frequency. Sigma wave for this person is at 11.2Hz.
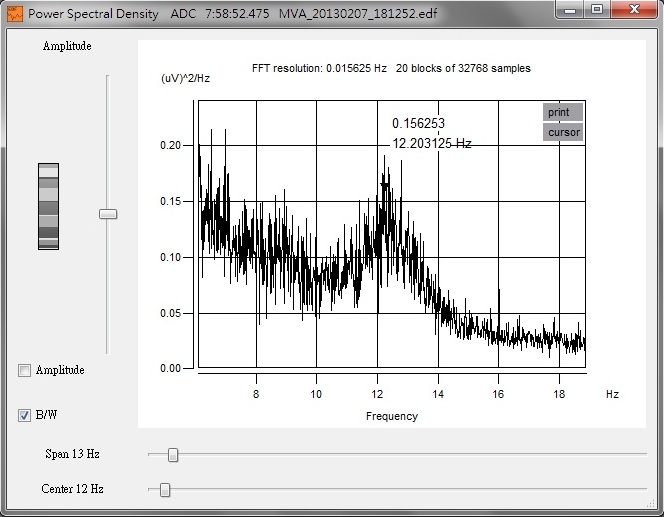
12. EEG: same analysis, and the sigma wave for a different person is at 12.2Hz. Not shown here, but the alpha wave frequency is also distinct from person to person, and everyone should learn about their own unique frequency numbers.
13. EEG+ECG(HRV): Meditation with breathing cycles of ~8sec. Top trace is EEG spectrogram, showing strong alpha wave, and super beta (gamma) activities. The 2nd trace is ECG showing heart beats with amplitude modulated by breathing. The 3rd trace is extracted HRV in beat-per-minute (bpm: 0.1V = 100 bpm), showing rhythms of ~8sec. The 4th trace is extracted amplitude of the heart pulses, showing strong modulation of the same rhythm.
 Meditation breathing 8s.jpg)
14. EEG+ECG(HRV) Meditation with breathing cycles of >40sec. All 4 traces are the same as above, the time scale is longer to see the longer breathing rhythm. The EEG shows strong alpha wave, and very light gamma wave. The ECG envelope is stronger, both in HRV and pulse amplitude modulations.
 Meditation breathing 40s.jpg)